diamonds %>%
  #calculate the volume
  mutate(volume = x * y * z) %>%
  #drop crazy outlier
  filter(volume < 2000) %>%
  ggplot(data = ., aes (x = cut, y = volume)) +
    geom_boxplot(aes(fill = cut))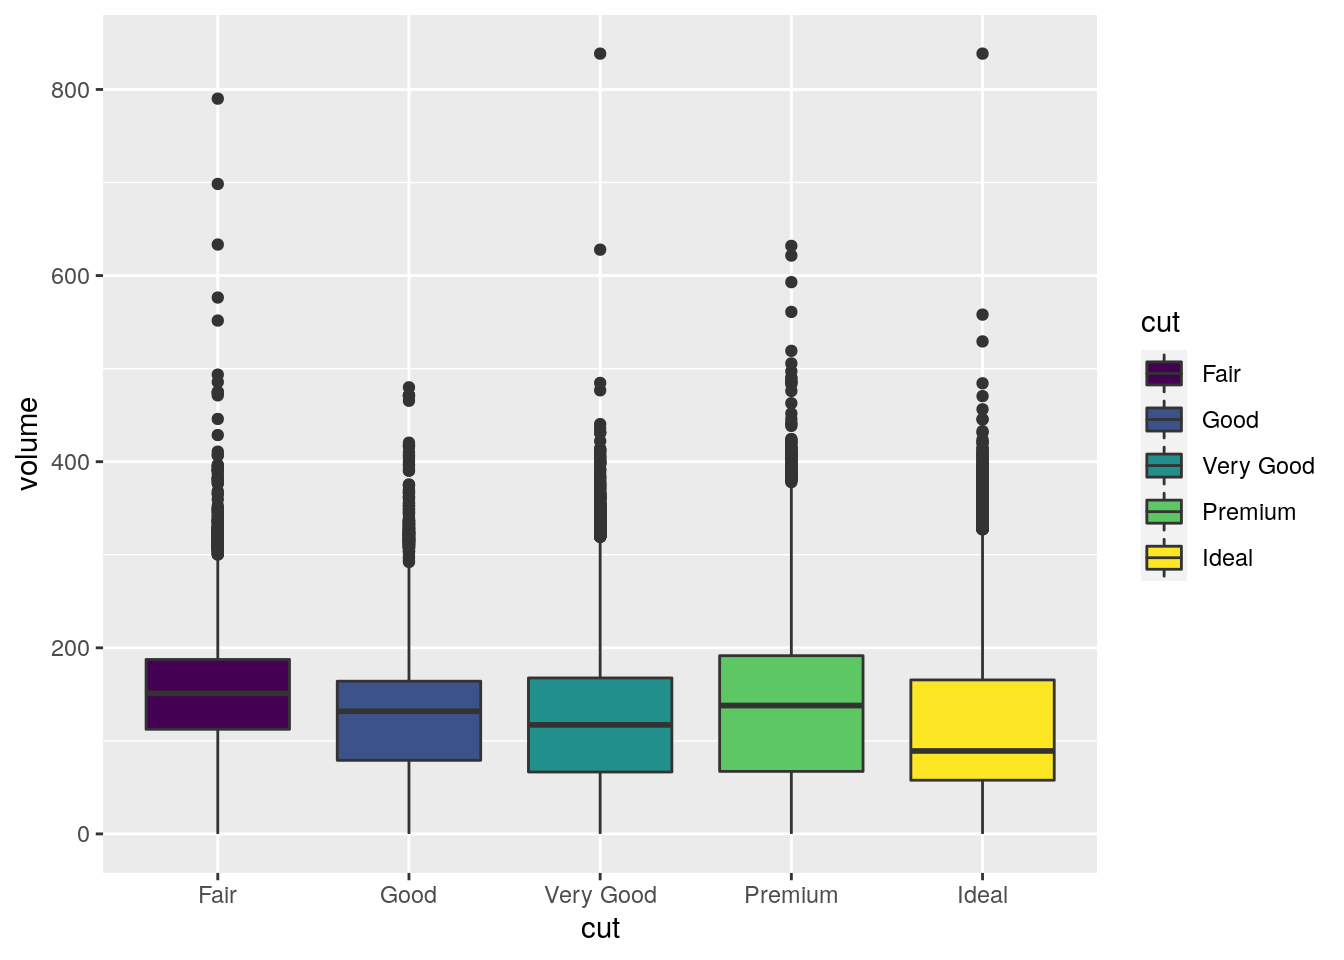
I’ve been getting more and more immersed into using tidyverse packages as time goes on. Every now and then I have trouble getting something to work that I could do very quickly in base R, but that seems to be happening less and less as more SO questions use the tidyverse and documentation gets better and better.
Anyways, I am a little late to the party but I recently discovered that you can pipe directly from your dplyr calls into ggplot2, manipulating and plotting your data all at once. I hate filling my environment with similar objects. These normally end up being something like dataframe1, dataframe2, dataframe3, etc. because I have no creativity when it comes to names and in the end becoming an unusable mess. Using this piping lets you try-out transformations, scaling, or centering and visualize them without having to add extra columns to your dataframe or create new objects.
Here’s how it works:
Go about your normal data wrangling with dplyr, maybe creating a new variable with mutate. Then, simply pipe into your ggplot call, using the . to represent the data you are feeding into it:
diamonds %>%
#calculate the volume
mutate(volume = x * y * z) %>%
#drop crazy outlier
filter(volume < 2000) %>%
ggplot(data = ., aes (x = cut, y = volume)) +
geom_boxplot(aes(fill = cut))
The other key thing to note is that once you switch over to ggplot you need to use + (plus sign) to pipe and not the magrittr style pipe (%>%). If not, you’ll get an error like this:
diamonds %>%
  #calculate the volume
  mutate(volume = x * y * z) %>%
  #drop crazy outlier
  filter(volume < 2000) %>%
  ggplot(data = ., aes (x = cut, y = volume))  %>% #this is the wrong pipe!
    geom_boxplot(aes(fill = cut))

#> Error: `data` must be a data frame, or other object coercible by `fortify()`, not an S3 object with class uneval
#> Did you accidentally pass `aes()` to the `data` argument?
Unfortunately that error isn’t very informative, but it has to with the incorrect pipe usage within the ggplot portion of the call.
And that’s it. Start using this piping and watch your workspace declutter itself!