library(ggplot2)
library(sf)
library(ggtext)
library(magick)


library(dplyr)Congressional Districts over time
Day 3 of the #30DayMapChallenge - Polygons
Just in time for Election Day next week, I thought I would map some congressional districts for Day 3 of the #30DayMapChallenge which is focused on polygons.
The data for this comes from a database of historical congressional districts hosted by UCLA and created by Jeffrey B. Lewis, Brandon DeVine, Lincoln Pitcher, and Kenneth C. Martis. I downloaded the data for the 70th and 114th Congress and subset out North Carolina because it is a particularly grievous offender of gerrymandering. It was also the focus of a Supreme Court case (Rucho v. Common Cause) that ultimately decided partisan gerrymandering was not something that fell under the realm of the judicial system, and left the map in place. Another aspect of this was the opinion, as Chief Justice John Roberts stated, gerrymandering “is nothing new”. But how do the districts now compare to districts from the 70th Congress, which served from 1927 - 1929.
nc.70 <- st_read("ncdist-070.gpkg")
nc.114 <- st_read("ncdist-114.gpkg")

#combine into one dataset
nc.all <- bind_rows(mutate(nc.70, congress = "70th Congress"),
                   mutate(nc.114, congress = "114th Congress"))
#simplify to speed up plotting
nc.all <- st_simplify(nc.all, preserveTopology = TRUE, dTolerance = 500) %>%
  #drop some columns for simplicity
  select(DISTRICT, congress, geom)
My plan is to animate moving between the two maps to highlight the unnatural gerrymandering of current district polygons. I had originally wanted to do this using the gganimate package but kept running into some issues where it kept hanging up when I tried to animate, so going back to the original magick package that gganimate relies on for now.
For this we’ll need to make two separate plots.
p.1 <- filter(nc.all, congress == "70th Congress") %>%
  ggplot() +
  geom_sf(fill = NA, color = "gray40") +
  theme_void() +
  labs(title = "Is gerrymandering 'nothing new'?",
       subtitle = "Comparing NC Congressional Districts from 1929 to 2017",
       caption = "#30DayMapChallenge<br>
        **Source**: Lewis et al. (UCLA 2013)<br>
       **Created by:**M. Evans") +
  annotate(geom = "text", x = -82, y = 34.3, label = "70th Congress\n(1927-1929)", family = "Baskerville",
           size = 5)+
  theme(plot.title = element_text(family = "Baskerville", size = 25),
        plot.subtitle = element_text(family = "Baskerville", size = 14),
        plot.caption = element_markdown(color = "gray40", size = 10))

p.1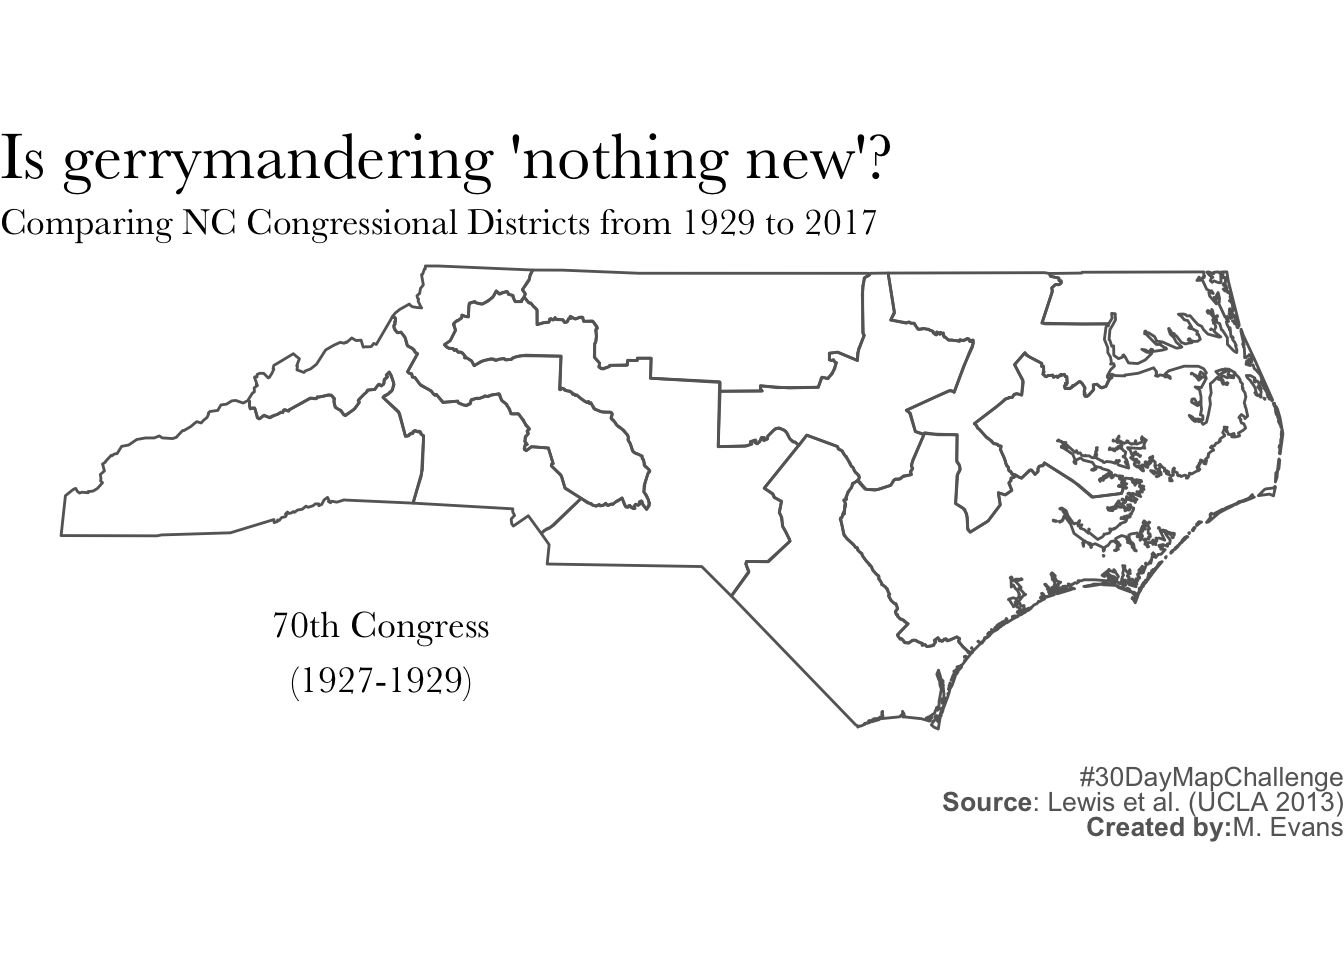
p.2 <- filter(nc.all, congress == "114th Congress") %>%
  ggplot() +
  geom_sf(fill = NA, color = "gray40") +
  theme_void() +
  labs(title = "Is gerrymandering 'nothing new'?",
       subtitle = "Comparing NC Congressional Districts from 1929 to 2017",
       caption = "#30DayMapChallenge<br>
        **Source**: Lewis et al. (UCLA 2013)<br>
       **Created by:**M. Evans") +
  annotate(geom = "text", x = -82, y = 34.3, label = "114th Congress\n(2015-2017)", family = "Baskerville",
           size = 5)+
  theme(plot.title = element_text(family = "Baskerville", size = 25),
        plot.subtitle = element_text(family = "Baskerville", size = 14),
        plot.caption = element_markdown(color = "gray40", size = 10))

p.2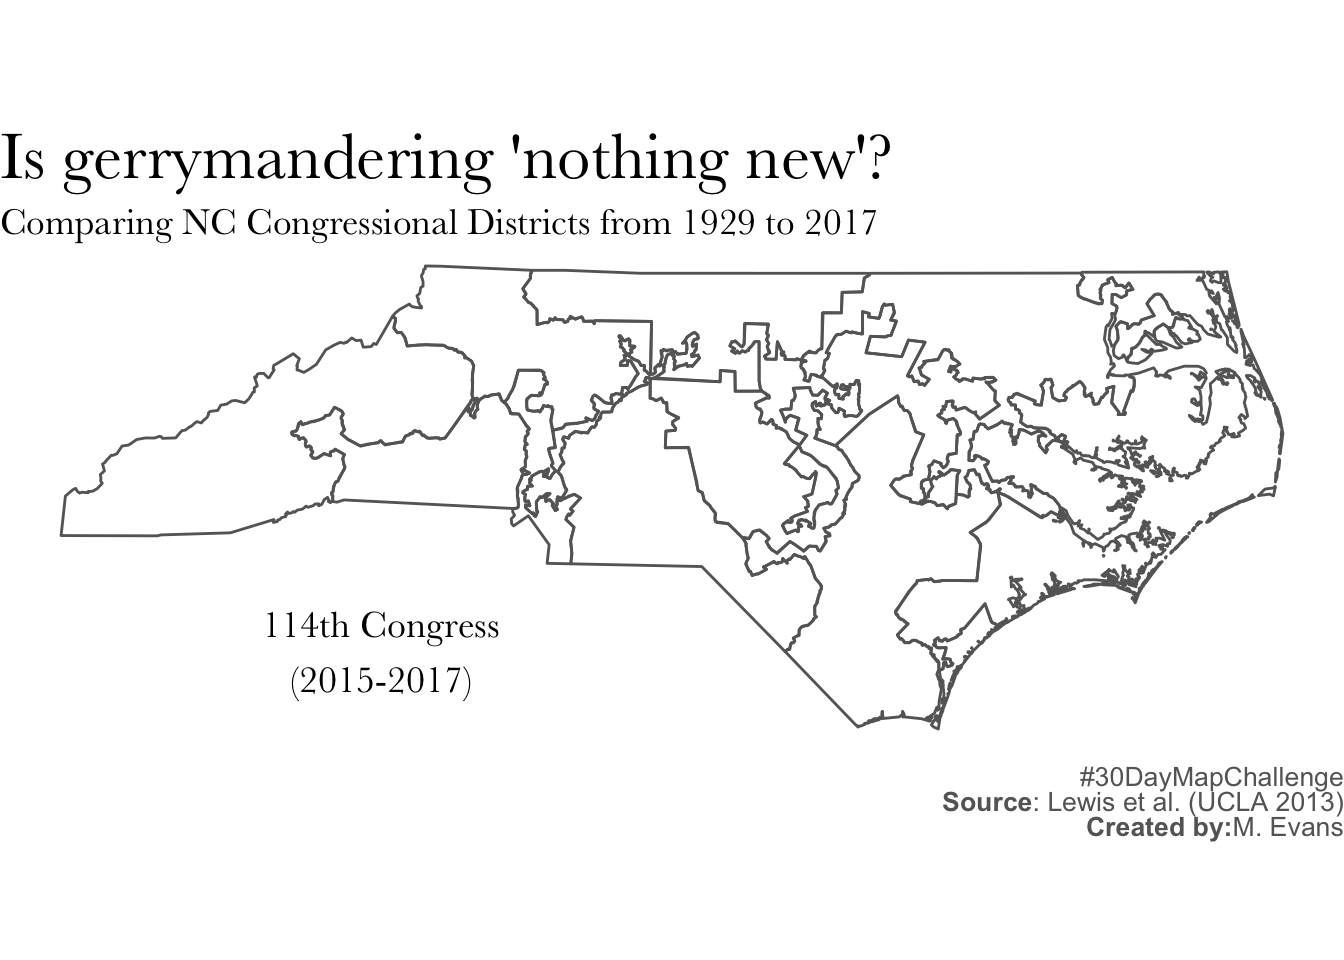
Now animate between the two:
img <- image_graph(860, 520, res = 100)
print(p.1)
#double image so it stays there a while with the morph
print(p.2)
print(p.2)
print(p.1)
print(p.1)
dev.off()
animation <- image_morph(img, frames = 20) %>% image_animate(fps = 10)image_write_gif(animation, "nc-anim.gif")